Create a run chart fields for dataframe df.
runchart(df, shift = TRUE, trend = FALSE, rephase = FALSE,
  output = "plot")
Arguments
| df | a data.frame which must consist of exactly two columns: a column of
type Date called |
|---|---|
| shift | include shifts? Defaults to |
| trend | include trends? Defaults to |
| rephase | rephase baselines? Defaults to |
| output | return a dataframe or a plot? Either one of
|
Value
Either a data.frame with runchart fields, or a plot.
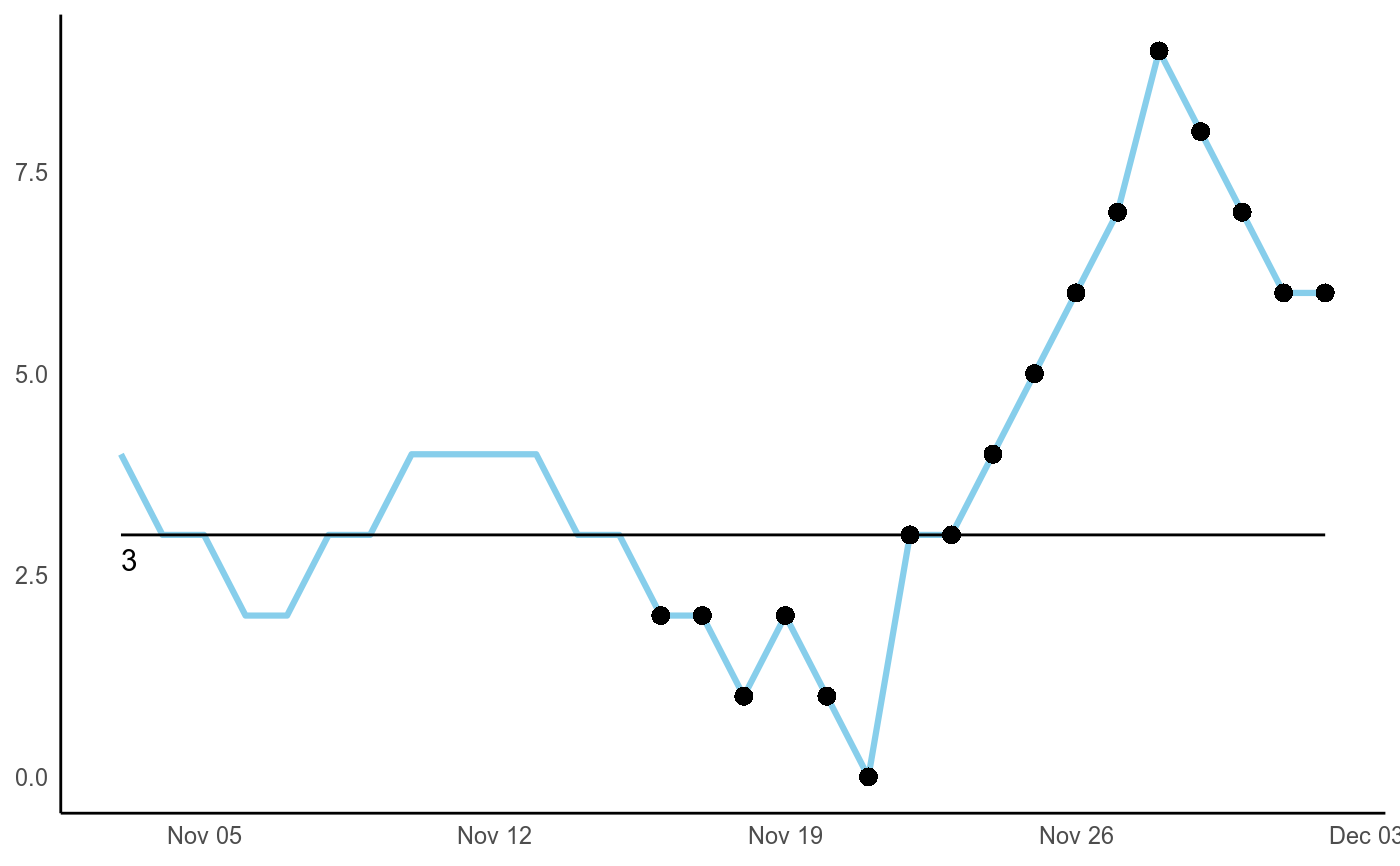
Examples
df <- data.frame(
date  = seq.Date(Sys.Date(), by = "day", length.out = 30),
value = c(4,3,3,2,2,3,3,4,4,4,4,3,3,2,2,1,2,1,0,3,3,4,5,6,7,9,8,7,6,6)
)
runchart(df)#> Warning: Removed 29 rows containing missing values (geom_text).#> Warning: Removed 13 rows containing missing values (geom_point).